Times table chart
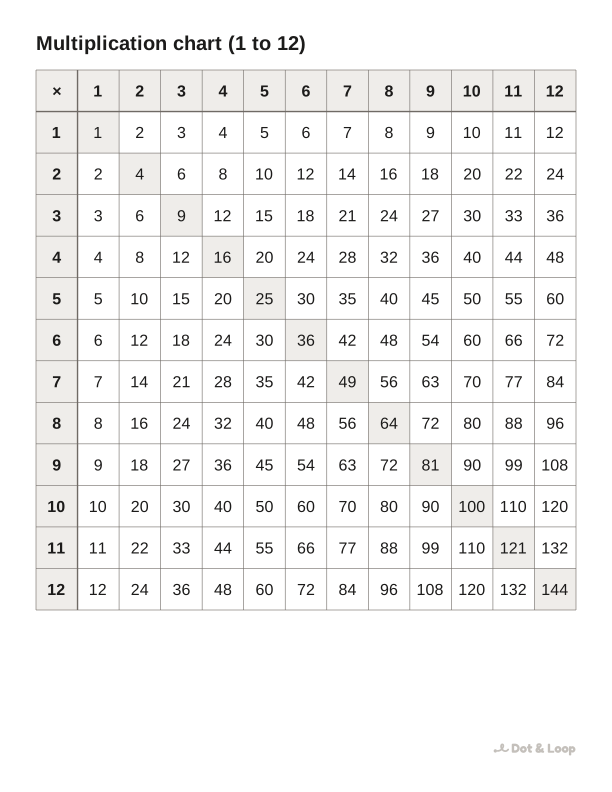
Every times table from 1 × 1 to 12 × 12 on one chart. Find a row and a column, and the answer is where they meet: row 7, column 8 gives 56.
| × | 1 | 2 | 3 | 4 | 5 | 6 | 7 | 8 | 9 | 10 | 11 | 12 |
|---|---|---|---|---|---|---|---|---|---|---|---|---|
| 1 | 1 | 2 | 3 | 4 | 5 | 6 | 7 | 8 | 9 | 10 | 11 | 12 |
| 2 | 2 | 4 | 6 | 8 | 10 | 12 | 14 | 16 | 18 | 20 | 22 | 24 |
| 3 | 3 | 6 | 9 | 12 | 15 | 18 | 21 | 24 | 27 | 30 | 33 | 36 |
| 4 | 4 | 8 | 12 | 16 | 20 | 24 | 28 | 32 | 36 | 40 | 44 | 48 |
| 5 | 5 | 10 | 15 | 20 | 25 | 30 | 35 | 40 | 45 | 50 | 55 | 60 |
| 6 | 6 | 12 | 18 | 24 | 30 | 36 | 42 | 48 | 54 | 60 | 66 | 72 |
| 7 | 7 | 14 | 21 | 28 | 35 | 42 | 49 | 56 | 63 | 70 | 77 | 84 |
| 8 | 8 | 16 | 24 | 32 | 40 | 48 | 56 | 64 | 72 | 80 | 88 | 96 |
| 9 | 9 | 18 | 27 | 36 | 45 | 54 | 63 | 72 | 81 | 90 | 99 | 108 |
| 10 | 10 | 20 | 30 | 40 | 50 | 60 | 70 | 80 | 90 | 100 | 110 | 120 |
| 11 | 11 | 22 | 33 | 44 | 55 | 66 | 77 | 88 | 99 | 110 | 121 | 132 |
| 12 | 12 | 24 | 36 | 48 | 60 | 72 | 84 | 96 | 108 | 120 | 132 | 144 |
Prints on US Letter and A4, in black and white. Free for home and classroom use.
Other sizes
How to use the chart
- Pick a number down the left side and a number along the top.
- Follow the row and the column until they meet. That box is the answer.
- Look at the shaded diagonal: these are the square numbers (1, 4, 9, 16…). The chart is the same on both sides of it, because 3 × 7 and 7 × 3 give the same answer.
- Once a table is known, cover its row with a strip of paper and test yourself.
Learn one table at a time
How to read a multiplication chart
A multiplication chart, also called a times table chart or multiplication grid, shows every answer from 1 × 1 up to 12 × 12 in one square. To find an answer, pick one number in the top row and one in the left column, then follow the row across and the column down until they meet. For 7 × 8, go to 7 on the left, slide across to the 8 column, and you land on 56.
Each row is one times table. The 6 row reads 6, 12, 18, 24 and so on, which is simply counting in sixes. Children who understand this see the chart as a set of skip-counting lists stacked on top of each other, rather than 144 separate facts to memorise. That shift makes the whole chart less scary.
Patterns hiding in the chart
The chart is worth more than a quick lookup. Spending a few minutes finding patterns builds the number sense that makes facts stick.
- The diagonal of square numbers. Running from the top left to the bottom right are 1, 4, 9, 16, 25 and so on up to 144. These are the square numbers, each one a number times itself. On our chart they are shaded.
- The chart is a mirror. The answer to 3 × 7 is in the same place as 7 × 3, reflected across that diagonal. This is the commutative property, and it means a child who knows 3 × 7 already knows 7 × 3. Of the 144 facts, only 78 are truly different.
- Every answer in the 2, 4, 6, 8, 10 and 12 rows is even. Odd times odd is the only way to get an odd answer.
- The 5 row ends in 5 or 0, and the 10 row always ends in 0.
- The 9 row has digits that add to 9. 18, 27, 36, 45: 1 + 8, 2 + 7, 3 + 6, 4 + 5. The tens digit also goes up by one while the ones digit goes down by one.
- The 11 row doubles the digit up to 99. 11, 22, 33 and on to 99, then 110, 121, 132.
Ask your child to colour one pattern at a time on a printed chart. Finding a pattern themselves is much more memorable than being told.
Which times tables to learn first
Schools in the US and UK teach the tables in a similar order, starting with the easiest patterns and building up:
- 2, 5 and 10. These follow simple counting patterns most children already know.
- 3, 4 and 8. The 4s are double the 2s, and the 8s are double the 4s.
- 6, 7, 9, 11 and 12. The 6s are double the 3s, the 9s have the finger trick and the digit pattern, and the 11s are easy up to 9 × 11.
The 7 times table is often left until last because it has the fewest patterns. The good news is that by the time a child gets there, they already know most 7s from other tables: 7 × 2, 7 × 3, 7 × 4, 7 × 5 and 7 × 10 are all done. The only new facts are 7 × 6, 7 × 7, 7 × 8, 7 × 9, 7 × 11 and 7 × 12.
When children are expected to know their times tables
In the United States, the Common Core standards expect children to know all products of two one-digit numbers from memory by the end of third grade (standard 3.OA.C.7). Most schools work on the 11 and 12 times tables in fourth grade.
In England, children are expected to know their tables up to 12 × 12 by the end of Year 4, around age 8 or 9. That year they take the Multiplication Tables Check, an online test of 25 questions with six seconds each.
These are targets, not deadlines. Some children know their tables by age 7, others need until 10. What matters most is steady progress and understanding what multiplication means.
How to use the chart without becoming dependent on it
A chart is a support, and supports should be removed gradually. Here is a way to move from looking up answers to knowing them:
- Use the full chart while learning what multiplication is. In the early weeks, a child can look up any answer. The aim is understanding, not speed.
- Cover the tables already known. Once the 2s, 5s and 10s are secure, cover those rows and columns with sticky notes. The chart now only shows facts still being learned, and it visibly shrinks.
- Fill in a blank chart. The blank multiplication chart is good practice: filling it in row by row shows what a child knows and what they are still looking up.
- Practise only the gaps. Use flashcards or the practice quiz for the facts that are still slow.
- Put the chart away for tests, keep it for checking. The goal is recall without the chart; it can still be used afterwards to check answers.
Chart 1 to 10, 1 to 12 or 1 to 20
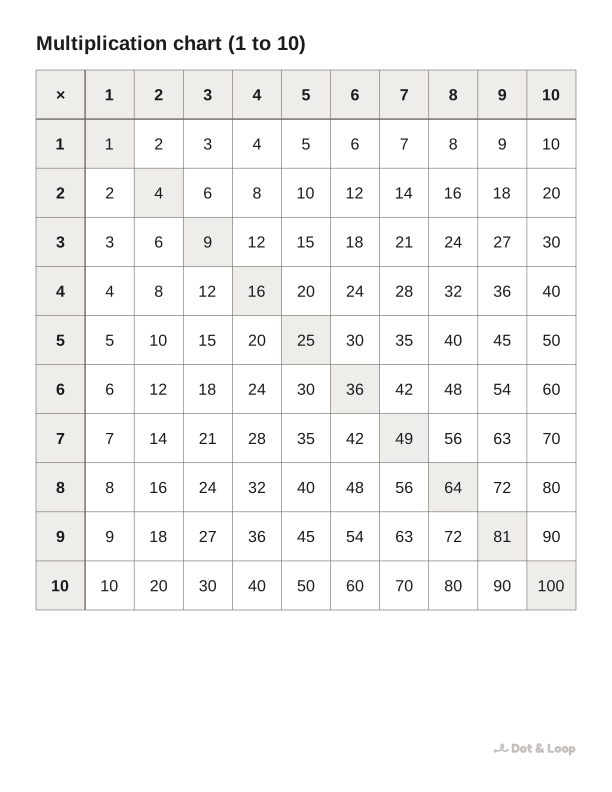
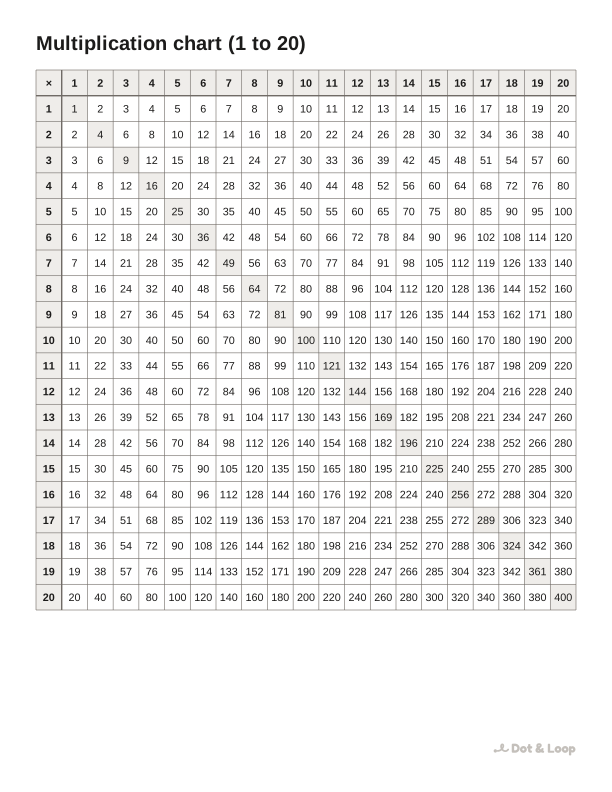
We offer three sizes of chart.
| Chart | Best for |
|---|---|
| 1 to 10 | Beginners and younger children. Larger numbers, easier to read. |
| 1 to 12 | The standard in most schools in the US and UK. |
| 1 to 20 | Older children, challenge work, and checking bigger products. |
All of them print on US Letter or A4, in black and white, and stay readable from a short distance when pinned on a wall.
Tricks for the hardest facts
Most children find a handful of facts hardest: 6 × 7, 6 × 8, 7 × 8, 8 × 8 and 7 × 7. A few memory hooks help.
- 5, 6, 7, 8: 56 = 7 × 8. The digits run in order.
- “Six times eight is forty-eight” rhymes, which helps it stick.
- “Seven sevens are forty-nine” has a rhythm children like.
- The 9s on your fingers: hold up ten fingers and fold down the finger for the number you are multiplying. Fingers to the left of the folded one are tens, fingers to the right are ones. For 9 × 7, fold the seventh finger: six fingers left, three right, so 63.
- Build from a fact you know. If 6 × 6 is 36, then 6 × 7 is one more 6: 42.
Printing tips
Print the chart at 100% scale (in some print dialogs this is called “actual size”) so the grid stays square and the numbers stay crisp. On a black and white printer the shaded headers and diagonal come out light grey, which keeps them visible without using much ink. For a chart that lasts, print it on card or slip it into a plastic sleeve; a dry-wipe pen on the sleeve also turns the blank chart into a reusable practice sheet.
Using the chart at home
Keep a printed chart where homework happens, not tucked in a folder. Point at it during everyday moments: “There are 4 packs of 6 yoghurts, where would that be on the chart?” Short, real questions help more than long drills. For printable practice beyond the chart, see the times table worksheets, the printable times tables with one table per page, or each table’s own page, such as the 7 times table.
A chart on the wall, not just in a folder
Children use what they can see. A chart pinned at eye level next to the homework table gets glanced at dozens of times a week, and each glance is a tiny bit of practice. Some families add a sticker to each row once that table is learned, so the chart becomes a progress board as well as a reference. When every row has its sticker, it is a good moment to swap the full chart for a blank one and see how much your child can fill in from memory.
Questions parents ask
How do you read a times table chart?
Find one number in the left column and the other in the top row. The answer is in the box where that row and column meet.
Why is the chart the same on both sides of the diagonal?
Because the order does not matter in multiplication: 4 × 9 and 9 × 4 are both 36. That halves the number of facts to learn.
Should my child learn up to 12 or 10?
Schools in England expect times tables up to 12 × 12. Many US schools stop at 10 × 10, then add 11 and 12 later. Start with the 1 to 10 chart if 12 feels like a lot.